When Machine Learning fails
Machine Learning has been used successfully for so many things and in so many apps that you'd think you can use it to predict just about anything you want. Sometimes, in the tech startup world, the term of "machine learning" functions a bit as fairy dust. As Stijn Debrouwere says, ML is core to many ideas for new apps, but when you start scratching the surface you realize that no one knows "how exactly the process should work and how it’ll do its magic".
I believe in the democratization of ML thanks to Prediction APIs such as Google's and BigML. For experienced ML practitioners, these APIs are useful to quickly test "learnability" and to try out ideas. For others, I think that, before using these APIs, it pays to have an understanding of why ML doesn't work all the time, and to use that understanding to reflect on potential issues while developing your idea.
The "hello world" of ML
To keep things simple, let's consider a binary classification task with objects that have only two attributes (so we can plot them). The "hello world" of ML is the iris classification task: you are shown a flower and you are to predict whether it is an iris setosa or an iris virginica. On a theoretical level, this is the same thing as any other classification task, for instance predicting whether an email is spam or not.
Flowers are characterized here by measurements of petal length and width. In ML-speak, we say that the length-width pair is the input and the type of flower or "class" (setosa/virginica) is the output. ML is a set of AI techniques where intelligence is built by referring to examples. We must have a set of example flowers for which we know the class (so we need an expert/teacher to label them). Once we have them, let's just plot the examples:
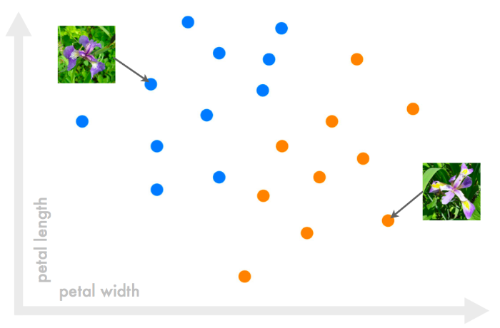
The most straightforward thing to do is to trace a line to separate the two classes. When a new flower is given, we plot it, see on which side of the line it falls, and predict the color correspondingly. That's it, that line is our ML algorithm for classification!

ML theory guides the choice of an optimal line (one that looks "straight" relative to the blue and orange clouds of points). It can also extend the idea of a linear boundary between classes to boundaries of any shape.

Representativeness of examples
There are three notable things that can make ML fail. The first is when new objects aren't similar enough to any of the examples.

We say that the machine fails to “generalize”. Generalizing means, in everyday language, extending your experience of something to something else which is close. This is precisely what the machine does here: the examples make up the machine's experience, and the machine colors new points based on the color of close example points.
The generalization problem occurs when there are not enough examples, or when the examples are not representative enough. The more example objects you have to compare new objects to, the more accurate predictions will be. Providing more examples works usually better than using more sophisticated algorithms. It paints a higher resolution picture of how things work in the real world.
If these examples are representative of the whole group of objects you may encounter, new inputs won't fall far from example inputs, thus making predictions more obvious to make. If you teach a kid what a car is and you only show him regular cars, the first time you'll show him a sports car or a concept car he'll maybe think it's a space ship…

Similar inputs, similar outputs?
Another thing that makes ML fail is when, among the examples, there often are similar inputs that are associated to different outputs. When that happens in a classification problem, it becomes difficult to clearly separate classes.

We previously assumed that there was a natural separation between classes. We started with a linear example and admitted we could deal with boundaries of any shape, but we still assumed that there was a boundary, which means that one class is in one region of the space and the other class is in another region. Why should things be this way, actually?
When using Machine Learning, we implicitly assume that there exists a relationship between inputs and outputs. If this is indeed the case, then similar inputs should be associated to similar outputs. When visualizing the objects that we aim to classify in a space (for instance a 2D space in the previous illustrations), similarity is equivalent to proximity in that space. This explains why points that are of the same color should be relatively close to each other and far from points of the other color, thus leading to the existence of a boundary between the two colors.
The machine relies on that same assumption that similar inputs should be associated to the same outputs, at least most of the time. It allows for some exceptions, but if these exceptions become the rule, the machine becomes unable to understand the underlying structure of the examples that were given to it. Typically, this happens when we haven't captured enough information in the input representation. We know that there is a relationship between the objects and the attribute we try to predict, but if the characterizations of these objects are too poor, the relationship won’t be visible. We need to add more, richer characterizations to our inputs so we can ”break” the similarities of those who were associated to different outputs. In our iris categorization example, this would be done by adding more measurements to petal length and width only, such as sepal length and width for instance.
We had only 2 dimensions initially in our example (1 dimension is 1 attribute/aspect/characterization of the object you try to classify). This made it possible to visualize objects with a 2D plot. You can still visualize things when you have 3 dimensions, but what if there are more? It is common to have tens or hundreds of dimensions in ML problems. There is still a space associated to that, even though we can’t visualize it. Objects of one class lie in one region of that space, and objects of the other class lie in the rest of the space. Maths can extend the notion of proximity to spaces of higher dimensions, determine boundaries, and tell you which side of the boundary an object is by computing the sign of an expression which involves all of the object’s N components (x1, x2, ... , xN). For a linear boundary, for instance, this expression has the following form:
- in 2D: w1 * x1 + w2 * x2 + b
- in 3D: w1 * x1 + w2 * x2 + w3 * x3 + b
- in 4D: w1 * x1 + w2 * x2 + w3 * x3 + w4 * x4 + b
- etc.
One way to see these expressions is to think of b as a bias term and of w1 ... wN as weights applied to the input components.
Noise
The issue of having similar inputs associated to dissimilar outputs may persist for another reason: noise in the outputs. By “noise” we mean that the example outputs that we recorded are not what they should be. Let me illustrate this: we implicitly assumed that our flower examples had been correctly classified... but this had to be done by someone at some point, right? An expert botanist had to look at the example flowers and say: “this is a setosa... this is a virginica”, and thus acted as a “teacher” who made it possible for the machine to learn. But what if the teacher had made mistakes? Plus, there is always a chance of introducing errors when recording data... Noise is also found in measurements, which are always a bit off because our tools and sensors are imperfect and only work to a certain degree of precision.
Other times, noise is caused by phenomena that are specific to the domain to which we want to apply predictions and that we fail to capture in the inputs. Ideally, the output y should be completely determined from the input x. Mathematically speaking, y should be a function of x: y=f(x). But consider for instance that we record real estate transaction prices along with property attributes, in order to create examples for later being able to predict the value of a property based on its attributes. There are circumstances that can bring a price below or above actual (true) market value, for instance when a property needs to be sold quickly or when someone wants to buy a property that wasn’t for sale originally. One way to model this is to assume that there exists a "true" output o (unobserved) such that the observed output y is the sum of o and a noise term n, where n is an independent random variable drawn from a certain probability distribution. o is assumed to be a function of x, so we can write: y = f(x) + n. Algorithms are designed to deal with noise to a certain point, but as you can imagine, the more noise there is, the more random things look, the harder it is to learn anything. In any case, the fact that we have “wrong” examples perturbs our ability to learn.
Looking at these three potential issues, it becomes clear that our success in applying Machine Learning is tied to our ability to gather a good set of well-characterized input-output examples… Do you have an idea that involves using ML? Do you already know how you would collect these examples? Have you specified what exactly is the question you're answering with predictions (and which are the potential answers)? Can you think of what best characterizes the objects on which you want to make predictions?
Enjoyed this article? Follow me on Twitter!